

Cluster status and metrics
Weaviate Cloud (WCD) exposes two ways of checking the cluster status:
- A web interface in the Weaviate Cloud console.
- An API endpoint that provides information about your Weaviate instance.
Select a cluster
Select your cluster
- Open the Weaviate Cloud console.
- Open the
CLUSTERselector in the left sidebar. - Select the cluster you want to inspect.
- The cluster
Dashboardopens.
Cluster metrics
Depending on the data available for your cluster, the following metrics dashboards are available:
Query LatencyIngestion ThroughputAverage Batch SizeObject Count
Explore cluster metrics
- Open the Weaviate Cloud console.
- Select the cluster you want to inspect from the
CLUSTERselector in the left sidebar. - Locate the cluster
Metricssection on the clusterDashboard. - Click the
View all Metricsbutton to find all the available metrics for your cluster.
Cluster status information
You can see the following cluster statistics at the top of the page:
Object countEndpoint health check
You can find the following information on the cluster Dashboard:
Name of the clusterREST EndpointgRPC EndpointAPI KeysRolesWeaviate Database versionCloud providerCloud regionCreated atProduct(for example,Free)Deployment(for example,Shared)Backup retention days(only for Shared Cloud cluster)Availability SLA(only for Shared Cloud cluster)
Product is the plan you pay for and Deployment is the infrastructure the cluster runs on. They are separate: a Free cluster runs on a Shared deployment, so Deployment: Shared on its own does not mean you are being billed.
Clusters also have an Advanced configuration section to configure or check the status of these additional settings:
Enable auto schema generationAllow all CORS originsEnable MCP Read-Only(see Weaviate MCP server. The MCP server itself is always enabled, and changes apply without a restart)
API Endpoint
To get cluster details programmatically, use the nodes REST endpoint.
The nodes endpoint returns an array of nodes. The nodes have the following fields:
name: Name of the node.status: Status of the node (one of:HEALTHY,UNHEALTHY,UNAVAILABLE,INDEXING).version: Version of Weaviate running on the node.gitHash: Short git hash of the latest commit of Weaviate running on the node.stats: Statistics for the node.shardCount: Total number of shards on the node.objectCountTotal number of indexed objects on the node.
shards: Array of shard statistics. To seeshardsdetails, setoutput == verbose.name: Name of the shard.class: Name of the collection stored on the shard.objectCount: Number of indexed objects on the shard.vectorQueueLength: Number of objects waiting to be indexed on the shard. (Available starting in Weaviate1.22whenASYNC_INDEXINGis enabled.)
Enabled modules
Each Weaviate instance has a set of enabled modules. This list will vary depending on the instance, due to the Weaviate version and Weaviate Cloud policies.
To see the list of enabled modules on a Weaviate Cloud instance:
- Open the Weaviate Cloud console.
Open the
CLUSTERselector in the left sidebar and select the cluster you want to check.On the cluster
Dashboard, scroll to theActive modulessection belowAdvanced configuration.- You can click on a module to open its documentation.
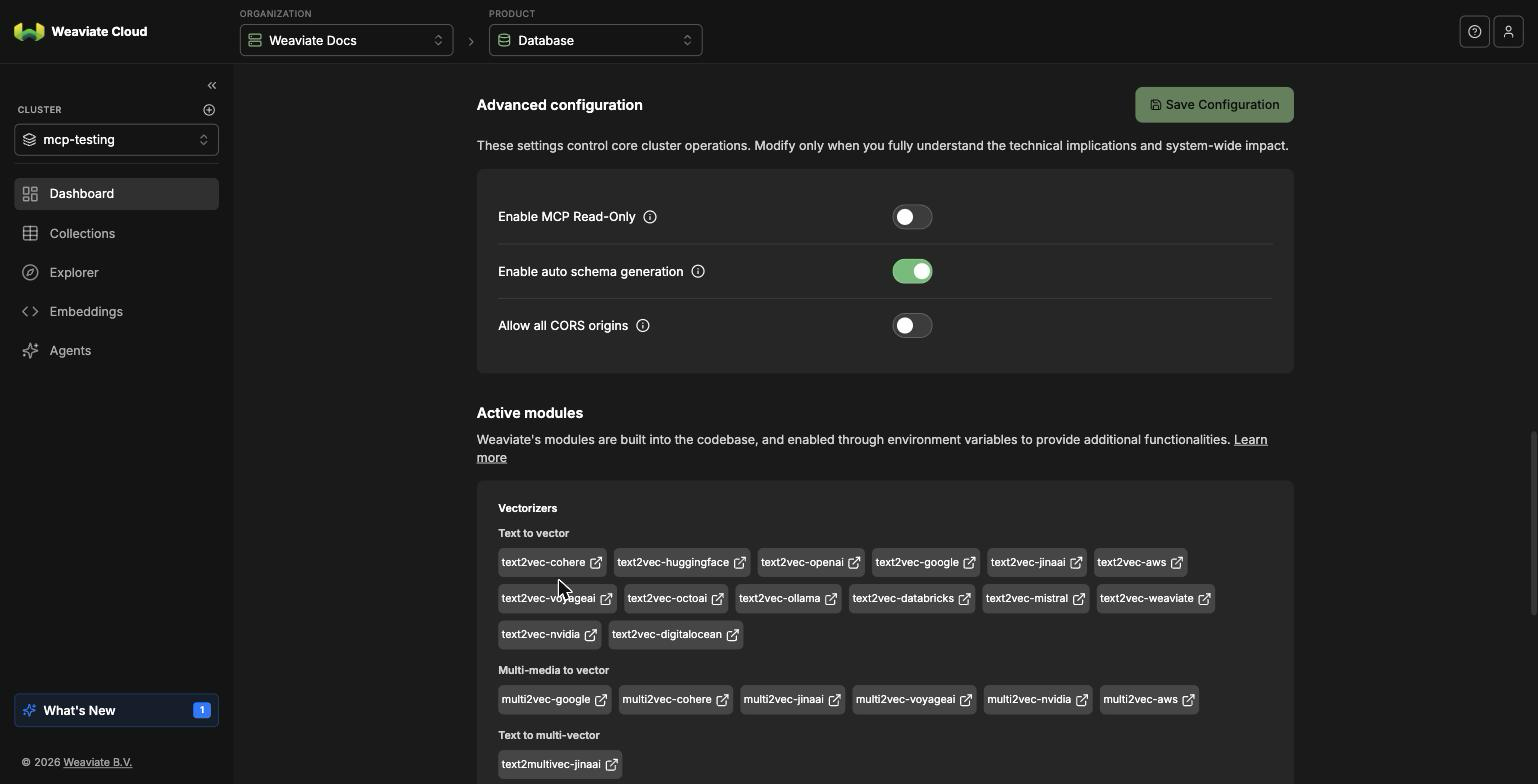
Active modules sits below
Advanced configuration on the cluster
Dashboard.
Support
If you use Weaviate Cloud (Database cluster(s) or Weaviate product in the cloud) or have a self-hosted support package, open a ticket in the Support Portal or email Weaviate support directly. To add a support plan, contact Weaviate sales.
Use the Support Portal for direct help from the Weaviate team: open and track tickets, and we'll respond in line with your support plan. The Community Forum is open to everyone, and a great place to ask questions, get help with your cluster, and connect with other developers. For all the ways to get help, see the Support overview.