Weaviate can expose Prometheus-compatible metrics for monitoring. A standard
Prometheus/Grafana setup can be used to visualize metrics on various
dashboards.
Metrics can be used to measure request latencies, import
speed, time spent on vector vs object storage, memory usage, application usage,
and more.
Enable within Weaviate
To tell Weaviate to collect metrics and expose them in a Prometheus-compatible
format, all that's required is to set the following environment variable :
PROMETHEUS_MONITORING_ENABLED=true By default, Weaviate will expose the metrics at <hostname>:2112/metrics. You
can optionally change the port to a custom port using the following environment
variable:
PROMETHEUS_MONITORING_PORT=3456 Scrape metrics from Weaviate
Metrics are typically scraped into a time-series database, such as Prometheus.
How you consume metrics depends on your setup and environment.
The Weaviate examples repo contains a fully pre-configured setup using
Prometheus, Grafana and some example
dashboards .
You can start up a full-setup including monitoring and dashboards with a single
command. In this setup the following components are used:
Docker Compose is used to provide a fully-configured setup that can be
started with a single command.
Weaviate is configured to expose Prometheus metrics as outlined in the
section above.
A Prometheus instance is started with the setup and configured to scrape
metrics from Weaviate every 15s.
A Grafana instance is started with the setup and configured to use the
Prometheus instance as a metrics provider. Additionally, it runs a dashboard
provider that contains a few sample dashboards.
Multi-tenancy
When using multi-tenancy, we suggest setting the PROMETHEUS_MONITORING_GROUP environment variable as true so that data across all tenants are grouped together for monitoring.
Obtainable Metrics
Versioning & breaking changes
Be aware that metrics do not follow the semantic versioning guidelines of other Weaviate features. Weaviate's main APIs are stable and breaking changes are extremely rare. Metrics, however, have shorter feature lifecycles. It can sometimes be necessary to introduce an incompatible change or entirely remove a metric, for example, because the cost of observing a specific metric in production has grown too high. As a result, it is possible that a Weaviate minor release contains a breaking change for the Monitoring system. If so, it will be clearly highlighted in the release notes .
The list of metrics that are obtainable through Weaviate's metric system is constantly being expanded. The complete list of metrics can be found in the source code files:
This page describes metrics and their uses. Typically metrics are quite granular, as they can always be aggregated later on. For example if the granularity is "shard", you could aggregate all "shard" metrics of the same "class" (collection) to obtain a class metrics, or aggregate all metrics to obtain the metric for the entire Weaviate instance.
Metric Description Labels Type weaviate_build_infoProvides general information about the build (What version is currently running? How long has this version been running, etc) version, revision, branch, goVersionGaugeweaviate_runtime_config_hashHash value of the currently active runtime configuration, useful for tracking when new configurations take effect sha256Gaugeweaviate_runtime_config_last_load_successIndicates whether the last loading attempt was successful (1 for success, 0 for failure) None Gaugeweaviate_schema_collectionsShows the total number of collections at any given point nodeIDGaugeweaviate_schema_shardsShows the total number of shards at any given point nodeID, status (HOT, COLD, WARM, FROZEN)Gauge
Object and query operations
Batch operations
Metric Description Labels Type batch_durations_msDuration of a single batch operation in ms. The operation label further defines what operation as part of the batch (e.g. object, inverted, vector) is being used. Granularity is a shard of a class. operation, class_name, shard_nameHistogrambatch_delete_durations_msDuration of a batch delete in ms. The operation label further defines what operation as part of the batch delete is being measured. Granularity is a shard of a class operation, class_name, shard_nameSummarybatch_size_bytesSize of a raw batch request batch in bytes apiSummarybatch_size_objectsNumber of objects in a batch None Summarybatch_size_tenantsNumber of unique tenants referenced in a batch None Summarybatch_objects_processed_totalNumber of objects processed in a batch class_name, shard_nameCounterbatch_objects_processed_bytesNumber of bytes processed in a batch class_name, shard_nameCounter
Object operations
Metric Description Labels Type object_countNumbers of objects present. Granularity is a shard of a class class_name, shard_nameGaugeobjects_durations_msDuration of an individual object operation, such as put, delete, etc. as indicated by the operation label, also as part of a batch. The step label adds additional precision to each operation. Granularity is a shard of a class. operation, step, class_name, shard_nameSummary
Query operations
Metric Description Labels Type concurrent_queries_countNumber of concurrently running query operations class_name, query_typeGaugequeries_durations_msDuration of queries in milliseconds class_name, query_typeHistogramqueries_filtered_vector_durations_msDuration of queries in milliseconds class_name, shard_name, operationSummaryconcurrent_goroutinesNumber of concurrently running goroutines class_name, query_typeGaugerequests_totalMetric that tracks all user requests to determine if it was successful or failed status, class_name, api, query_typeGaugequery_dimensions_totalThe vector dimensions used by any read-query that involves vectors query_type, operation, class_nameCounterquery_dimensions_combined_totalThe vector dimensions used by any read-query that involves vectors, aggregated across all classes and shards None Counter
Vector index
General vector index
Metric Description Labels Type vector_index_sizeThe total capacity of the vector index. Typically larger than the number of vectors imported as it grows proactively. class_name, shard_nameGaugevector_index_operationsTotal number of mutating operations on the vector index. The operation itself is defined by the operation label. operation, class_name, shard_nameGaugevector_index_durations_msDuration of regular vector index operation, such as insert or delete. The operation itself is defined through the operation label. The step label adds more granularity to each operation. operation, step, class_name, shard_nameSummaryvector_index_maintenance_durations_msDuration of a sync or async vector index maintenance operation. The operation itself is defined through the operation label. operation, class_name, shard_nameSummaryvector_index_tombstonesNumber of currently active tombstones in the vector index. Will go up on each incoming delete and go down after a completed repair operation. class_name, shard_nameGaugevector_index_tombstone_cleanup_threadsNumber of currently active threads for repairing/cleaning up the vector index after deletes have occurred. class_name, shard_nameGaugevector_index_tombstone_cleanedTotal number of deleted and removed vectors after repair operations. class_name, shard_nameCountervector_index_tombstone_unexpected_totalTotal number of unexpected tombstones that were found, for example because a vector was not found for an existing id in the index class_name, shard_name, operationCountervector_index_tombstone_cycle_start_timestamp_secondsUnix epoch timestamp of the start of the current tombstone cleanup cycle class_name, shard_nameGaugevector_index_tombstone_cycle_end_timestamp_secondsUnix epoch timestamp of the end of the last tombstone cleanup cycle. A negative value indicates that the cycle is still running class_name, shard_nameGaugevector_index_tombstone_cycle_progressA ratio (percentage) of the progress of the current tombstone cleanup cycle. 0 indicates the very beginning, 1 is a complete cycle. class_name, shard_nameGaugevector_dimensions_sumTotal dimensions in a shard class_name, shard_nameGaugevector_segments_sumTotal segments in a shard if quantization enabled class_name, shard_nameGauge
Vector index (IVF-specific)
Metric Description Labels Type vector_index_postingsThe size of the vector index postings. Typically much lower than number of vectors. class_name, shard_nameGaugevector_index_posting_size_vectorsThe size of individual vectors in each posting list class_name, shard_nameHistogramvector_index_pending_background_operationsNumber of background operations yet to be processed operation, class_name, shard_nameGaugevector_index_background_operations_durations_msDuration of typical vector index background operations (split, merge, reassign) operation, class_name, shard_nameSummaryvector_index_store_operations_durations_msDuration of store operations (put, append, get) operation, class_name, shard_nameSummary
Async index queue
Metric Description Labels Type queue_sizeNumber of records in the queue class_name, shard_nameGaugequeue_disk_usageDisk usage of the queue class_name, shard_nameGaugequeue_pausedWhether the queue is paused class_name, shard_nameGaugequeue_countNumber of queues class_name, shard_nameGaugequeue_partition_processing_duration_msDuration in ms of a single partition processing class_name, shard_nameHistogramvector_index_queue_insert_countNumber of insert operations added to the vector index queue class_name, shard_name, target_vectorCountervector_index_queue_delete_countNumber of delete operations added to the vector index queue class_name, shard_name, target_vectorCounter
Tombstone management
Metric Description Labels Type tombstone_find_local_entrypointTotal number of tombstone delete local entrypoint calls class_name, shard_nameCountertombstone_find_global_entrypointTotal number of tombstone delete global entrypoint calls class_name, shard_nameCountertombstone_reassign_neighborsTotal number of tombstone reassign neighbor calls class_name, shard_nameCountertombstone_delete_list_sizeDelete list size of tombstones class_name, shard_nameGauge
LSM store
The following sections provide detailed metrics for LSM (Log-Structured Merge-tree) bucket operations and replication functionality.
General LSM store
Metric Description Labels Type lsm_active_segmentsNumber of currently present segments per shard. Granularity is shard of a class. Grouped by strategy. strategy, class_name, shard_name, pathGaugelsm_objects_bucket_segment_countNumber of segments per shard in the objects bucket strategy, class_name, shard_name, pathGaugelsm_compressed_vecs_bucket_segment_countNumber of segments per shard in the vectors_compressed bucket strategy, class_name, shard_name, pathGaugelsm_segment_countNumber of segments by level strategy, class_name, shard_name, path, levelGaugelsm_segment_objectsNumber of entries per LSM segment by level. Granularity is shard of a class. Grouped by strategy and level. strategy, class_name, shard_name, path, levelGaugelsm_segment_sizeSize of LSM segment by level and unit strategy, class_name, shard_name, path, level, unitGaugelsm_segment_unloadedNumber of unloaded segments strategy, class_name, shard_name, pathGaugelsm_memtable_sizeSize of memtable by path strategy, class_name, shard_name, pathGaugelsm_memtable_durations_msTime in ms for a bucket operation to complete strategy, class_name, shard_name, path, operationSummarylsm_bitmap_buffers_usageNumber of bitmap buffers used by size size, operationCounter
LSM bucket operations
These metrics track read and write operations on LSM buckets, providing detailed visibility into database performance.
Metric Description Labels Type lsm_bucket_read_operation_countTotal number of LSM bucket read operations requested operation (get), component (active_memtable, flushing_memtable, segment_group)Counterlsm_bucket_read_operation_ongoingNumber of LSM bucket read operations currently in progress operation (get), component (active_memtable, flushing_memtable, segment_group)Gaugelsm_bucket_read_operation_failure_countNumber of failed LSM bucket read operations operation (get), component (active_memtable, flushing_memtable, segment_group)Counterlsm_bucket_read_operation_duration_secondsDuration of LSM bucket read operations in seconds operation (get), component (active_memtable, flushing_memtable, segment_group)Histogramlsm_bucket_write_operation_countTotal number of LSM bucket write operations requested operation (put, delete)Counterlsm_bucket_write_operation_ongoingNumber of LSM bucket write operations currently in progress operation (put, delete)Gaugelsm_bucket_write_operation_failure_countNumber of failed LSM bucket write operations operation (put, delete)Counterlsm_bucket_write_operation_duration_secondsDuration of LSM bucket write operations in seconds operation (put, delete)Histogram
LSM bucket lifecycle
These metrics track the initialization and shutdown of LSM buckets.
Metric Description Labels Type lsm_bucket_init_countTotal number of LSM bucket initializations requested strategyCounterlsm_bucket_init_in_progressNumber of LSM bucket initializations currently in progress strategyGaugelsm_bucket_init_failure_countNumber of failed LSM bucket initializations strategyCounterlsm_bucket_init_duration_secondsDuration of LSM bucket initialization in seconds strategyHistogramlsm_bucket_shutdown_countTotal number of LSM bucket shutdowns requested strategyCounterlsm_bucket_shutdown_in_progressNumber of LSM bucket shutdowns currently in progress strategyGaugelsm_bucket_shutdown_duration_secondsDuration of LSM bucket shutdown in seconds strategyHistogramlsm_bucket_shutdown_failure_countNumber of failed LSM bucket shutdowns strategyCounter
LSM bucket cursors
These metrics track cursor usage patterns in LSM buckets.
Metric Description Labels Type lsm_bucket_opened_cursorsNumber of opened LSM bucket cursors strategyCounterlsm_bucket_open_cursorsNumber of currently open LSM bucket cursors strategyGaugelsm_bucket_cursor_duration_secondsDuration of LSM bucket cursor operations in seconds strategyHistogram
LSM segment metrics
These metrics provide visibility into LSM segment storage and size distribution.
Metric Description Labels Type lsm_bucket_segment_totalTotal number of LSM bucket segments strategyGaugelsm_bucket_segment_size_bytesSize of LSM bucket segments in bytes strategyHistogram
LSM compaction
These metrics track compaction operations that merge and optimize LSM segments.
Metric Description Labels Type lsm_bucket_compaction_countTotal number of LSM bucket compactions requested strategyCounterlsm_bucket_compaction_in_progressNumber of LSM bucket compactions currently in progress strategyGaugelsm_bucket_compaction_failure_countNumber of failed LSM bucket compactions strategyCounterlsm_bucket_compaction_noop_countNumber of times the periodic LSM bucket compaction task ran but found nothing to compact strategyCounterlsm_bucket_compaction_duration_secondsDuration of LSM bucket compaction in seconds strategyHistogram
LSM memtable operations
These metrics track memtable flush operations that persist in-memory data to disk.
Metric Description Labels Type lsm_memtable_flush_totalTotal number of LSM memtable flushes strategyCounterlsm_memtable_flush_in_progressNumber of LSM memtable flushes in progress strategyGaugelsm_memtable_flush_failures_totalTotal number of failed LSM memtable flushes strategyCounterlsm_memtable_flush_duration_secondsDuration of LSM memtable flush in seconds strategyHistogramlsm_memtable_flush_size_bytesSize of LSM memtable at flushing time, in bytes strategyHistogram
LSM WAL recovery
These metrics track Write-Ahead Log (WAL) recovery operations during startup.
Metric Description Labels Type lsm_bucket_wal_recovery_countTotal number of LSM bucket WAL recoveries requested strategyCounterlsm_bucket_wal_recovery_in_progressNumber of LSM bucket WAL recoveries currently in progress strategyGaugelsm_bucket_wal_recovery_failure_countNumber of failed LSM bucket WAL recoveries strategyCounterlsm_bucket_wal_recovery_duration_secondsDuration of LSM bucket WAL recovery in seconds strategyHistogram
Schema & cluster consensus
Schema & RAFT consensus
Metric Description Labels Type schema_writes_secondsDuration of schema writes (which always involve the leader) typeSummaryschema_reads_local_secondsDuration of local schema reads that do not involve the leader typeSummaryschema_reads_leader_secondsDuration of schema reads that are passed to the leader typeSummaryschema_wait_for_version_secondsDuration of waiting for a schema version to be reached typeSummary
Schema transactions (deprecated)
Metric Description Labels Type schema_tx_opened_totalTotal number of opened schema transactions ownershipCounterschema_tx_closed_totalTotal number of closed schema transactions. A close must be either successful or failed ownership, statusCounterschema_tx_duration_secondsMean duration of a tx by status ownership, statusSummary
RAFT metrics (internal)
Metric Description Labels Type weaviate_internal_counter_raft_applyNumber of transactions in the configured interval None Counterweaviate_internal_counter_raft_state_candidateNumber of times the raft server initiated an election None Counterweaviate_internal_counter_raft_state_followerNumber of times in the configured interval that the raft server became a follower None Summaryweaviate_internal_counter_raft_state_leaderNumber of times the raft server became a leader None Counterweaviate_internal_counter_raft_transition_heartbeat_timeoutNumber of times that the node transitioned to candidate state after not receiving a heartbeat message from the last known leader None Counterweaviate_internal_gauge_raft_commitNumLogsNumber of logs processed for application to the finite state machine in a single batch None Gaugeweaviate_internal_gauge_raft_leader_dispatchNumLogsNumber of logs committed to disk in the most recent batch None Gaugeweaviate_internal_gauge_raft_leader_oldestLogAgeThe number of milliseconds since the oldest log in the leader's log store was written None Gaugeweaviate_internal_gauge_raft_peersThe number of peers in the raft cluster configuration None Gaugeweaviate_internal_sample_raft_boltdb_logBatchSizeMeasures the total size in bytes of logs being written to the db in a single batch quantile=0.5, 0.9, 0.99Summaryweaviate_internal_sample_raft_boltdb_logSizeMeasures the size of logs being written to the db quantile=0.5, 0.9, 0.99Summaryweaviate_internal_sample_raft_boltdb_logsPerBatchMeasures the number of logs being written per batch to the db quantile=0.5, 0.9, 0.99Summaryweaviate_internal_sample_raft_boltdb_writeCapacityTheoretical write capacity in terms of the number of logs that can be written per second quantile=0.5, 0.9, 0.99Summaryweaviate_internal_sample_raft_thread_fsm_saturationAn approximate measurement of the proportion of time the Raft FSM goroutine is busy and unavailable to accept new work quantile=0.5, 0.9, 0.99Summaryweaviate_internal_sample_raft_thread_main_saturationAn approximate measurement of the proportion of time the main Raft goroutine is busy and unavailable to accept new work (percentage) quantile=0.5, 0.9, 0.99Summaryweaviate_internal_timer_raft_boltdb_getLogMeasures the amount of time spent reading logs from the db (in ms) quantile=0.5, 0.9, 0.99Summaryweaviate_internal_timer_raft_boltdb_storeLogsTime required to record any outstanding logs since the last request to append entries for the given node quantile=0.5, 0.9, 0.99Summaryweaviate_internal_timer_raft_commitTimeTime required to commit a new entry to the raft log on the leader node quantile=0.5, 0.9, 0.99Summaryweaviate_internal_timer_raft_fsm_applyNumber of logs committed by the finite state machine since the last interval quantile=0.5, 0.9, 0.99Summaryweaviate_internal_timer_raft_fsm_enqueueTime required to queue up a batch of logs for the finite state machine to apply quantile=0.5, 0.9, 0.99Summaryweaviate_internal_timer_raft_leader_dispatchLogTime required for the leader node to write a log entry to disk quantile=0.5, 0.9, 0.99Summary
Memberlist (internal)
Metric Description Labels Type weaviate_internal_sample_memberlist_queue_broadcastsShows the number of messages in the broadcast queue of Memberlist quantile=0.5, 0.9, 0.99Summaryweaviate_internal_timer_memberlist_gossipShows the latency distribution of the each gossip made in Memberlist quantile=0.5, 0.9, 0.99Summary
System resources
File I/O & memory
Metric Description Labels Type file_io_writes_total_bytesTotal number of bytes written to disk operation, strategySummaryfile_io_reads_total_bytesTotal number of bytes read from disk operationSummarymmap_operations_totalTotal number of mmap operations operation, strategyCountermmap_proc_mapsNumber of entries in /proc/self/maps None Gauge
Async operations
Metric Description Labels Type async_operations_runningNumber of currently running async operations. The operation itself is defined through the operation label. operation, class_name, shard_name, pathGauge
Checksum
Metric Description Labels Type checksum_validation_duration_secondsDuration of checksum validation None Summarychecksum_bytes_readNumber of bytes read during checksum validation None Summary
Startup
Metric Description Labels Type startup_progressA ratio (percentage) of startup progress for a particular component in a shard operation, class_name, shard_nameGaugestartup_durations_msDuration of individual startup operations in ms. The operation itself is defined through the operation label. operation, class_name, shard_nameSummarystartup_diskio_throughputDisk I/O throughput in bytes/s at startup operations, such as reading back the HNSW index or recovering LSM segments. The operation itself is defined by the operation label. operation, class_name, shard_nameSummary
Backup & restore
Metric Description Labels Type backup_restore_msDuration of a backup restore backend_name, class_nameSummarybackup_restore_class_msDuration restoring class class_nameSummarybackup_restore_init_msStartup phase of a backup restore backend_name, class_nameSummarybackup_restore_from_backend_msFile transfer stage of a backup restore backend_name, class_nameSummarybackup_store_to_backend_msFile transfer stage of a backup store backend_name, class_nameSummarybucket_pause_durations_msBucket pause durations bucket_dirSummarybackup_restore_data_transferredTotal number of bytes transferred during a backup restore backend_name, class_nameCounterbackup_store_data_transferredTotal number of bytes transferred during a backup store backend_name, class_nameCounterweaviate_restore_phase_duration_secondsDuration of restore phases (prepare, object_storage_download, schema_apply) phaseHistogram
Shard management
Metric Description Labels Type shards_loadedNumber of shards loaded None Gaugeshards_unloadedNumber of shards not loaded None Gaugeshards_loadingNumber of shards in process of loading None Gaugeshards_unloadingNumber of shards in process of unloading None Gaugeweaviate_index_shards_totalTotal number of shards per index status status (READONLY, INDEXING, LOADING, READY, SHUTDOWN)Gaugeweaviate_index_shard_status_update_duration_secondsTime taken to update shard status in seconds status (READONLY, INDEXING, LOADING, READY, SHUTDOWN)Histogram
Modules & extensions
Vectorization (Text2Vec)
Metric Description Labels Type t2v_concurrent_batchesNumber of batches currently running vectorizerGauget2v_batch_queue_duration_secondsTime of a batch spend in specific portions of the queue vectorizer, operationHistogramt2v_request_duration_secondsDuration of an individual request to the vectorizer vectorizerHistogramt2v_tokens_in_batchNumber of tokens in a user-defined batch vectorizerHistogramt2v_tokens_in_requestNumber of tokens in an individual request sent to the vectorizer vectorizerHistogramt2v_rate_limit_statsRate limit stats for the vectorizer vectorizer, statGauget2v_repeat_statsWhy batch scheduling is repeated vectorizer, statGauget2v_requests_per_batchNumber of requests required to process an entire (user) batch vectorizerHistogram
Tokenizer
Metric Description Labels Type tokenizer_duration_secondsDuration of a tokenizer operation tokenizerHistogramtokenizer_requests_totalNumber of tokenizer requests tokenizerCountertokenizer_initialize_duration_secondsDuration of a tokenizer initialization operation tokenizerHistogramtoken_count_totalNumber of tokens processed tokenizerCountertoken_count_per_requestNumber of tokens processed per request tokenizerHistogram
Module & external API
Metric Description Labels Type weaviate_module_requests_totalNumber of module requests to external APIs op, apiCounterweaviate_module_request_duration_secondsDuration of an individual request to a module external API op, apiHistogramweaviate_module_requests_per_batchNumber of items in a batch op, apiHistogramweaviate_module_request_size_bytesSize (in bytes) of the request sent to an external API op, apiHistogramweaviate_module_response_size_bytesSize (in bytes) of the response received from an external API op, apiHistogramweaviate_vectorizer_request_tokensNumber of tokens in the request sent to an external vectorizer inout, apiHistogramweaviate_module_request_single_countNumber of single-item external API requests op, apiCounterweaviate_module_request_batch_countNumber of batched module requests op, apiCounterweaviate_module_error_totalNumber of module errors op, module, endpoint, status_codeCounterweaviate_module_call_error_totalNumber of module errors (related to external calls) module, endpoint, status_codeCounterweaviate_module_response_status_totalNumber of API response statuses op, endpoint, statusCounterweaviate_module_batch_error_totalNumber of batch errors operation, class_nameCounter
Usage Tracking
Metric Description Labels Type weaviate_usage_{gcs|s3}_operations_totalTotal number of operations for module labels operation (collect/upload), status (success/error)Counterweaviate_usage_{gcs|s3}_operation_latency_secondsLatency of usage operations in seconds operation (collect/upload)Histogramweaviate_usage_{gcs|s3}_resource_countNumber of resources tracked by module resource_type (collections/shards/backups)Gaugeweaviate_usage_{gcs|s3}_uploaded_file_size_bytesSize of the uploaded usage file in bytes None Gauge
Replication
Async replication
These metrics track asynchronous replication operations for maintaining data consistency across replicas.
Metric Description Labels Type async_replication_goroutines_runningNumber of currently running async replication goroutines type (hashbeater, hashbeat_trigger)Gaugeasync_replication_hashtree_init_countCount of async replication hashtree initializations None Counterasync_replication_hashtree_init_runningNumber of currently running hashtree initializations None Gaugeasync_replication_hashtree_init_failure_countCount of async replication hashtree initialization failures None Counterasync_replication_hashtree_init_duration_secondsDuration of hashtree initialization in seconds None Histogramasync_replication_iteration_countCount of async replication comparison iterations None Counterasync_replication_iteration_failure_countCount of async replication iteration failures None Counterasync_replication_iteration_duration_secondsDuration of async replication comparison iterations in seconds None Histogramasync_replication_iteration_runningNumber of currently running async replication iterations None Gaugeasync_replication_hashtree_diff_duration_secondsDuration of async replication hashtree diff computation in seconds None Histogramasync_replication_object_digests_diff_duration_secondsDuration of async replication object digests diff computation in seconds None Histogramasync_replication_propagation_countCount of async replication propagation executions None Counterasync_replication_propagation_failure_countCount of async replication propagation failures None Counterasync_replication_propagation_object_countCount of objects propagated by async replication None Counterasync_replication_propagation_duration_secondsDuration of async replication propagation in seconds None Histogram
Replication coordinator
These metrics track the replication coordinator's read and write operations across replicas.
Metric Description Labels Type replication_coordinator_writes_succeed_allCount of requests succeeding a write to all replicas None Counterreplication_coordinator_writes_succeed_someCount of requests succeeding a write to some replicas > CL but less than all None Counterreplication_coordinator_writes_failedCount of requests failing due to consistency level None Counterreplication_coordinator_reads_succeed_allCount of requests succeeding a read from CL replicas None Counterreplication_coordinator_reads_succeed_someCount of requests succeeding a read from some replicas < CL but more than zero None Counterreplication_coordinator_reads_failedCount of requests failing due to read from replicas None Counterreplication_read_repair_countCount of read repairs started None Counterreplication_read_repair_failureCount of read repairs failed None Counterreplication_coordinator_writes_duration_secondsDuration in seconds of write operations to replicas None Histogramreplication_coordinator_reads_duration_secondsDuration in seconds of read operations from replicas None Histogramreplication_read_repair_duration_secondsDuration in seconds of read repair operations None Histogram
Sample Dashboards
Weaviate does not ship with any dashboards by default, but here is a list of
dashboards being used by the various Weaviate teams, both during development,
and when helping users. These do not come with any support, but may still be
helpful. Treat them as inspiration to design your own dashboards which fit
your uses perfectly:
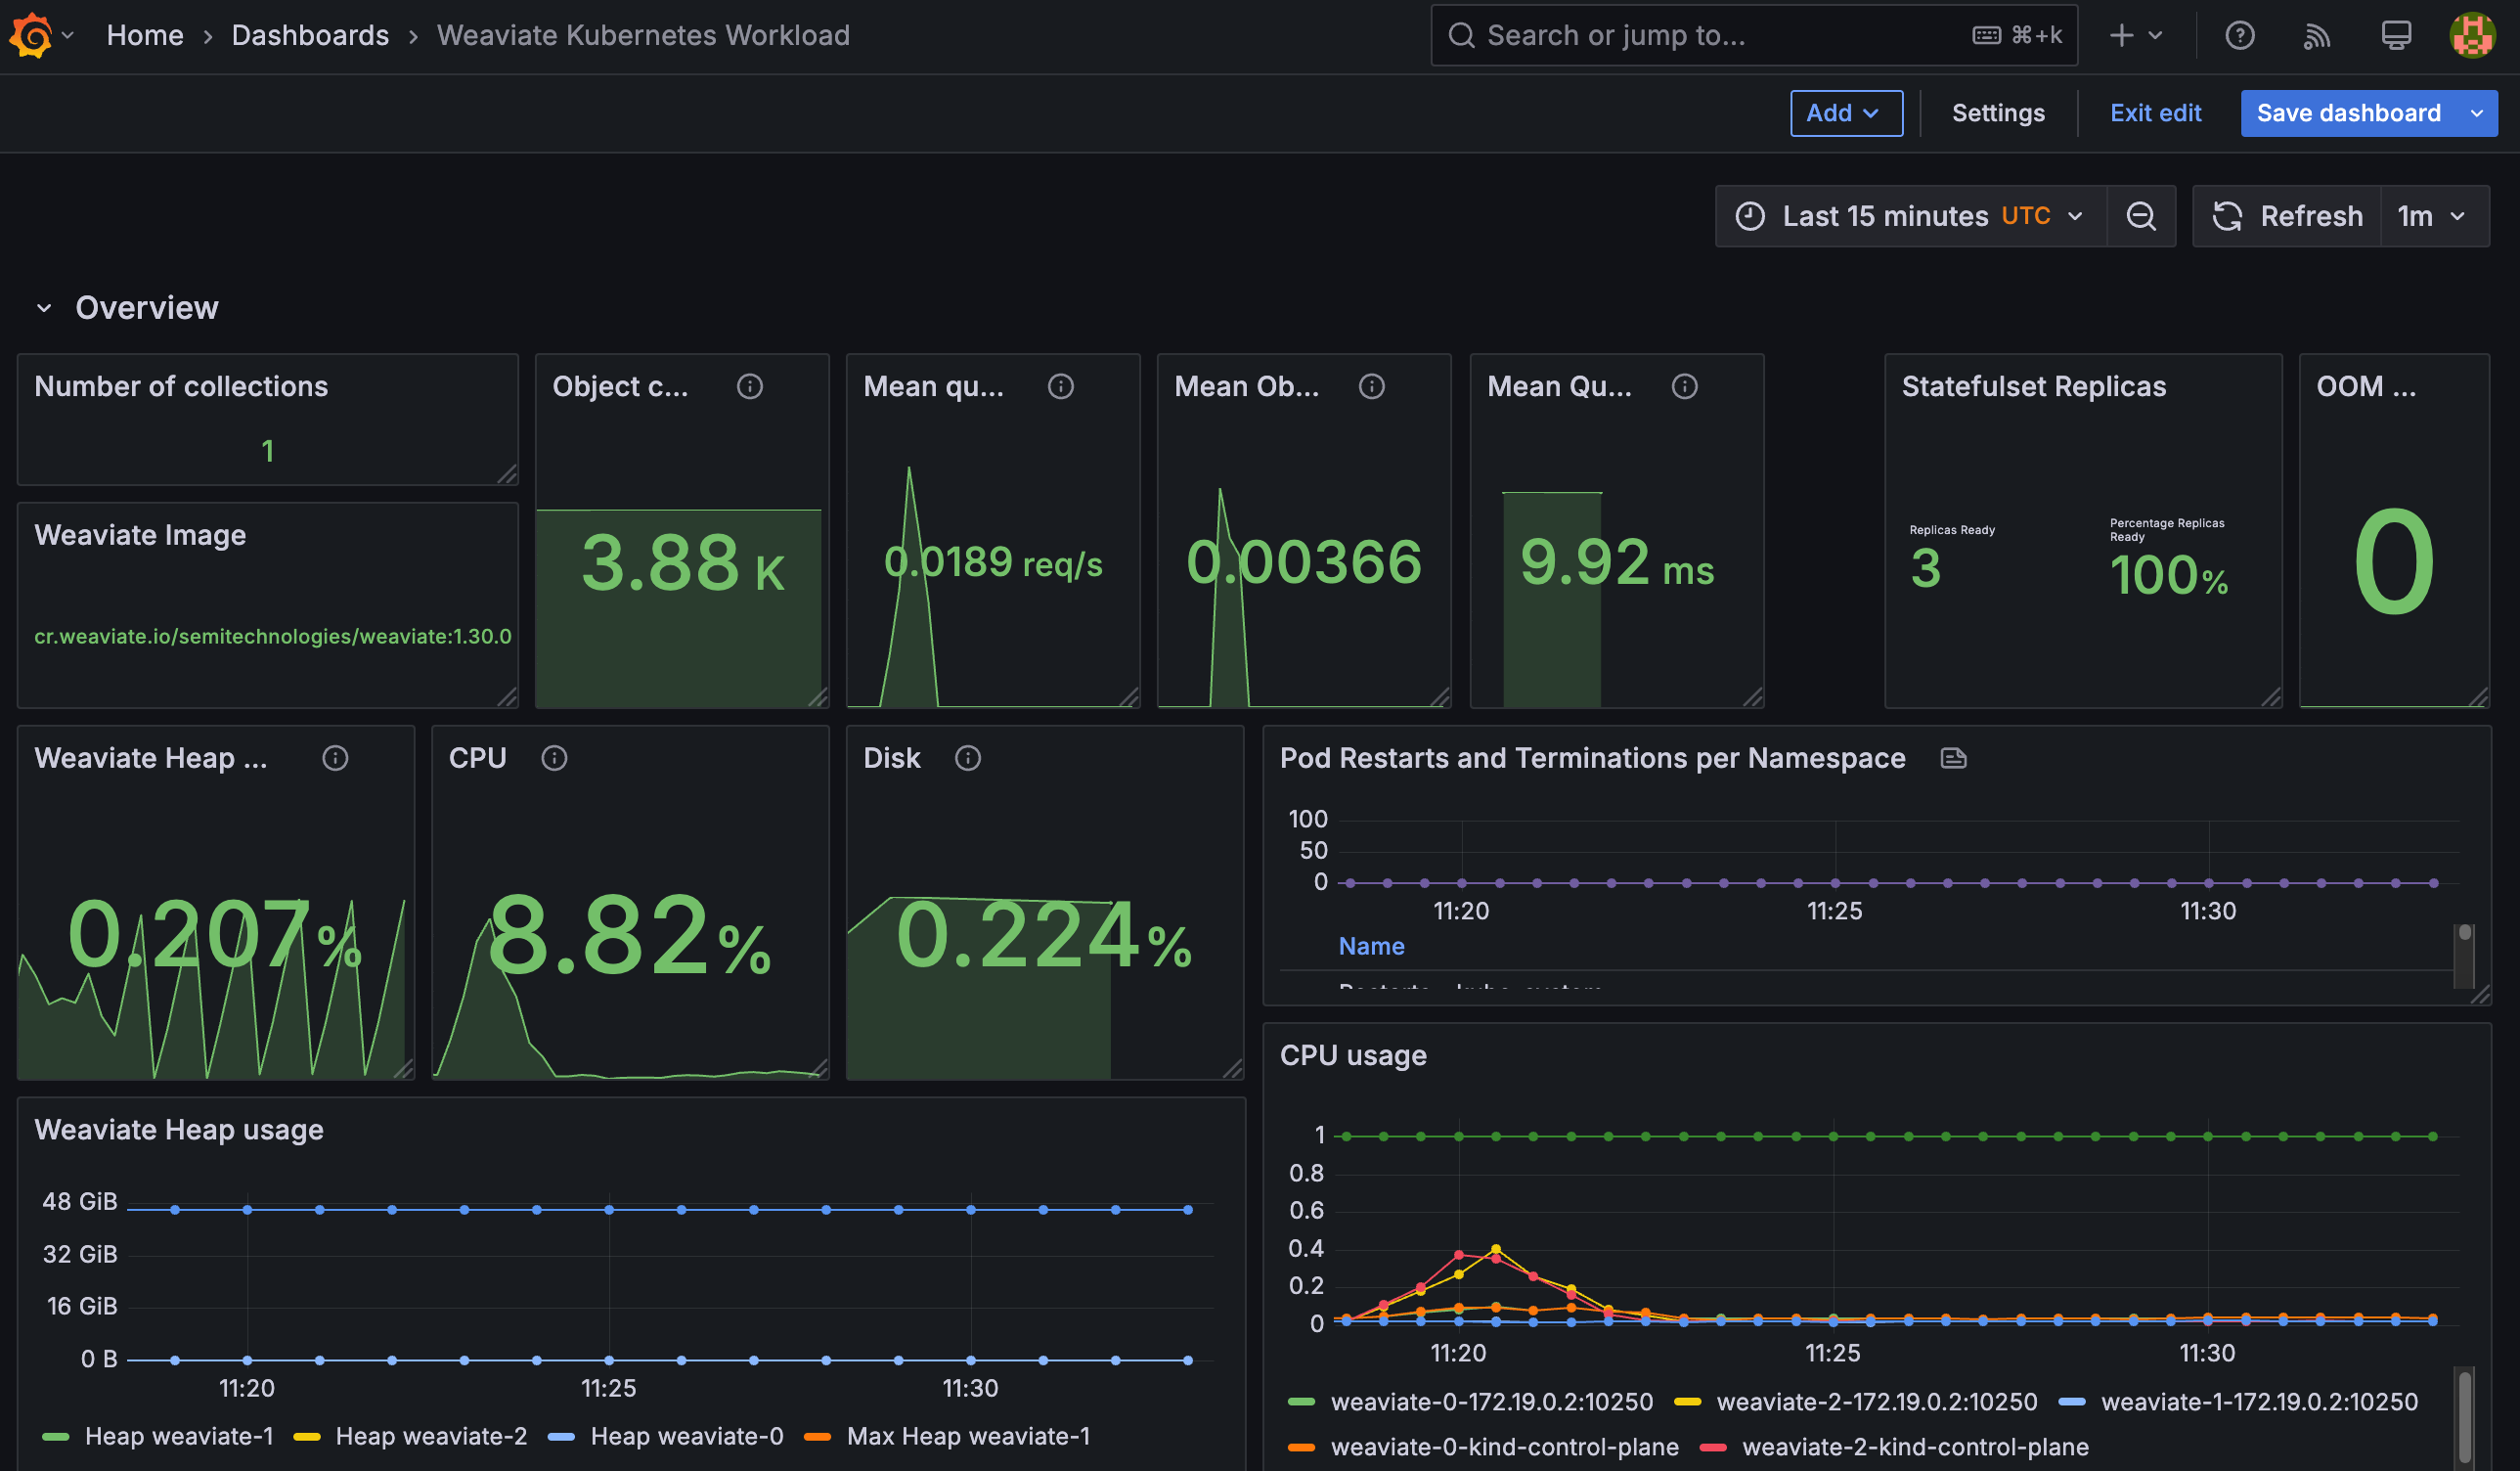
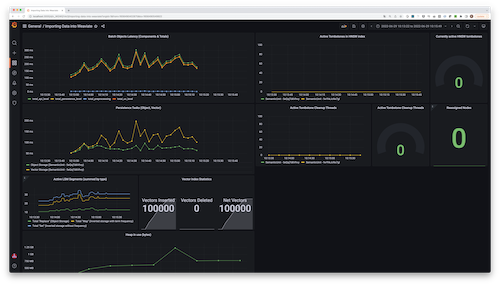
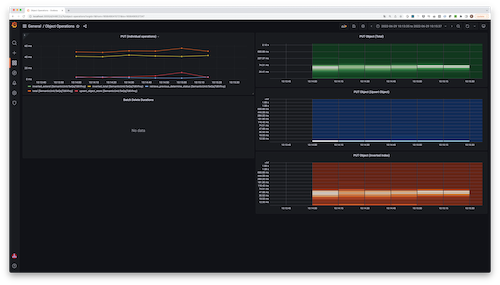
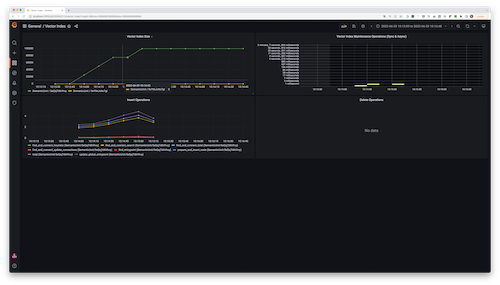
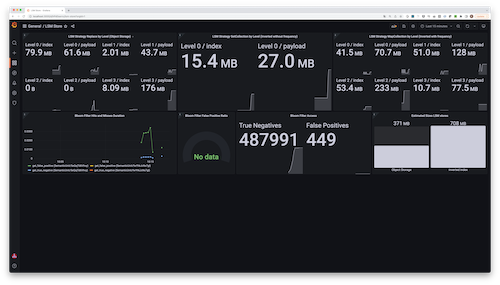
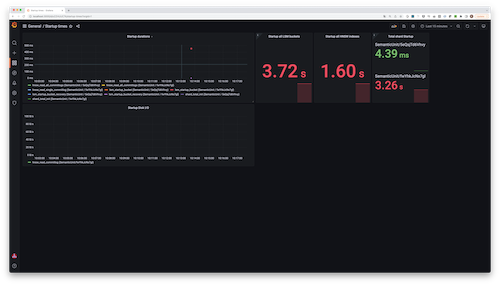
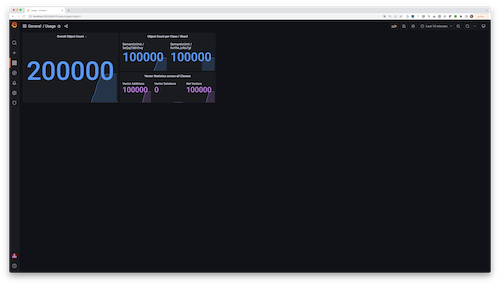
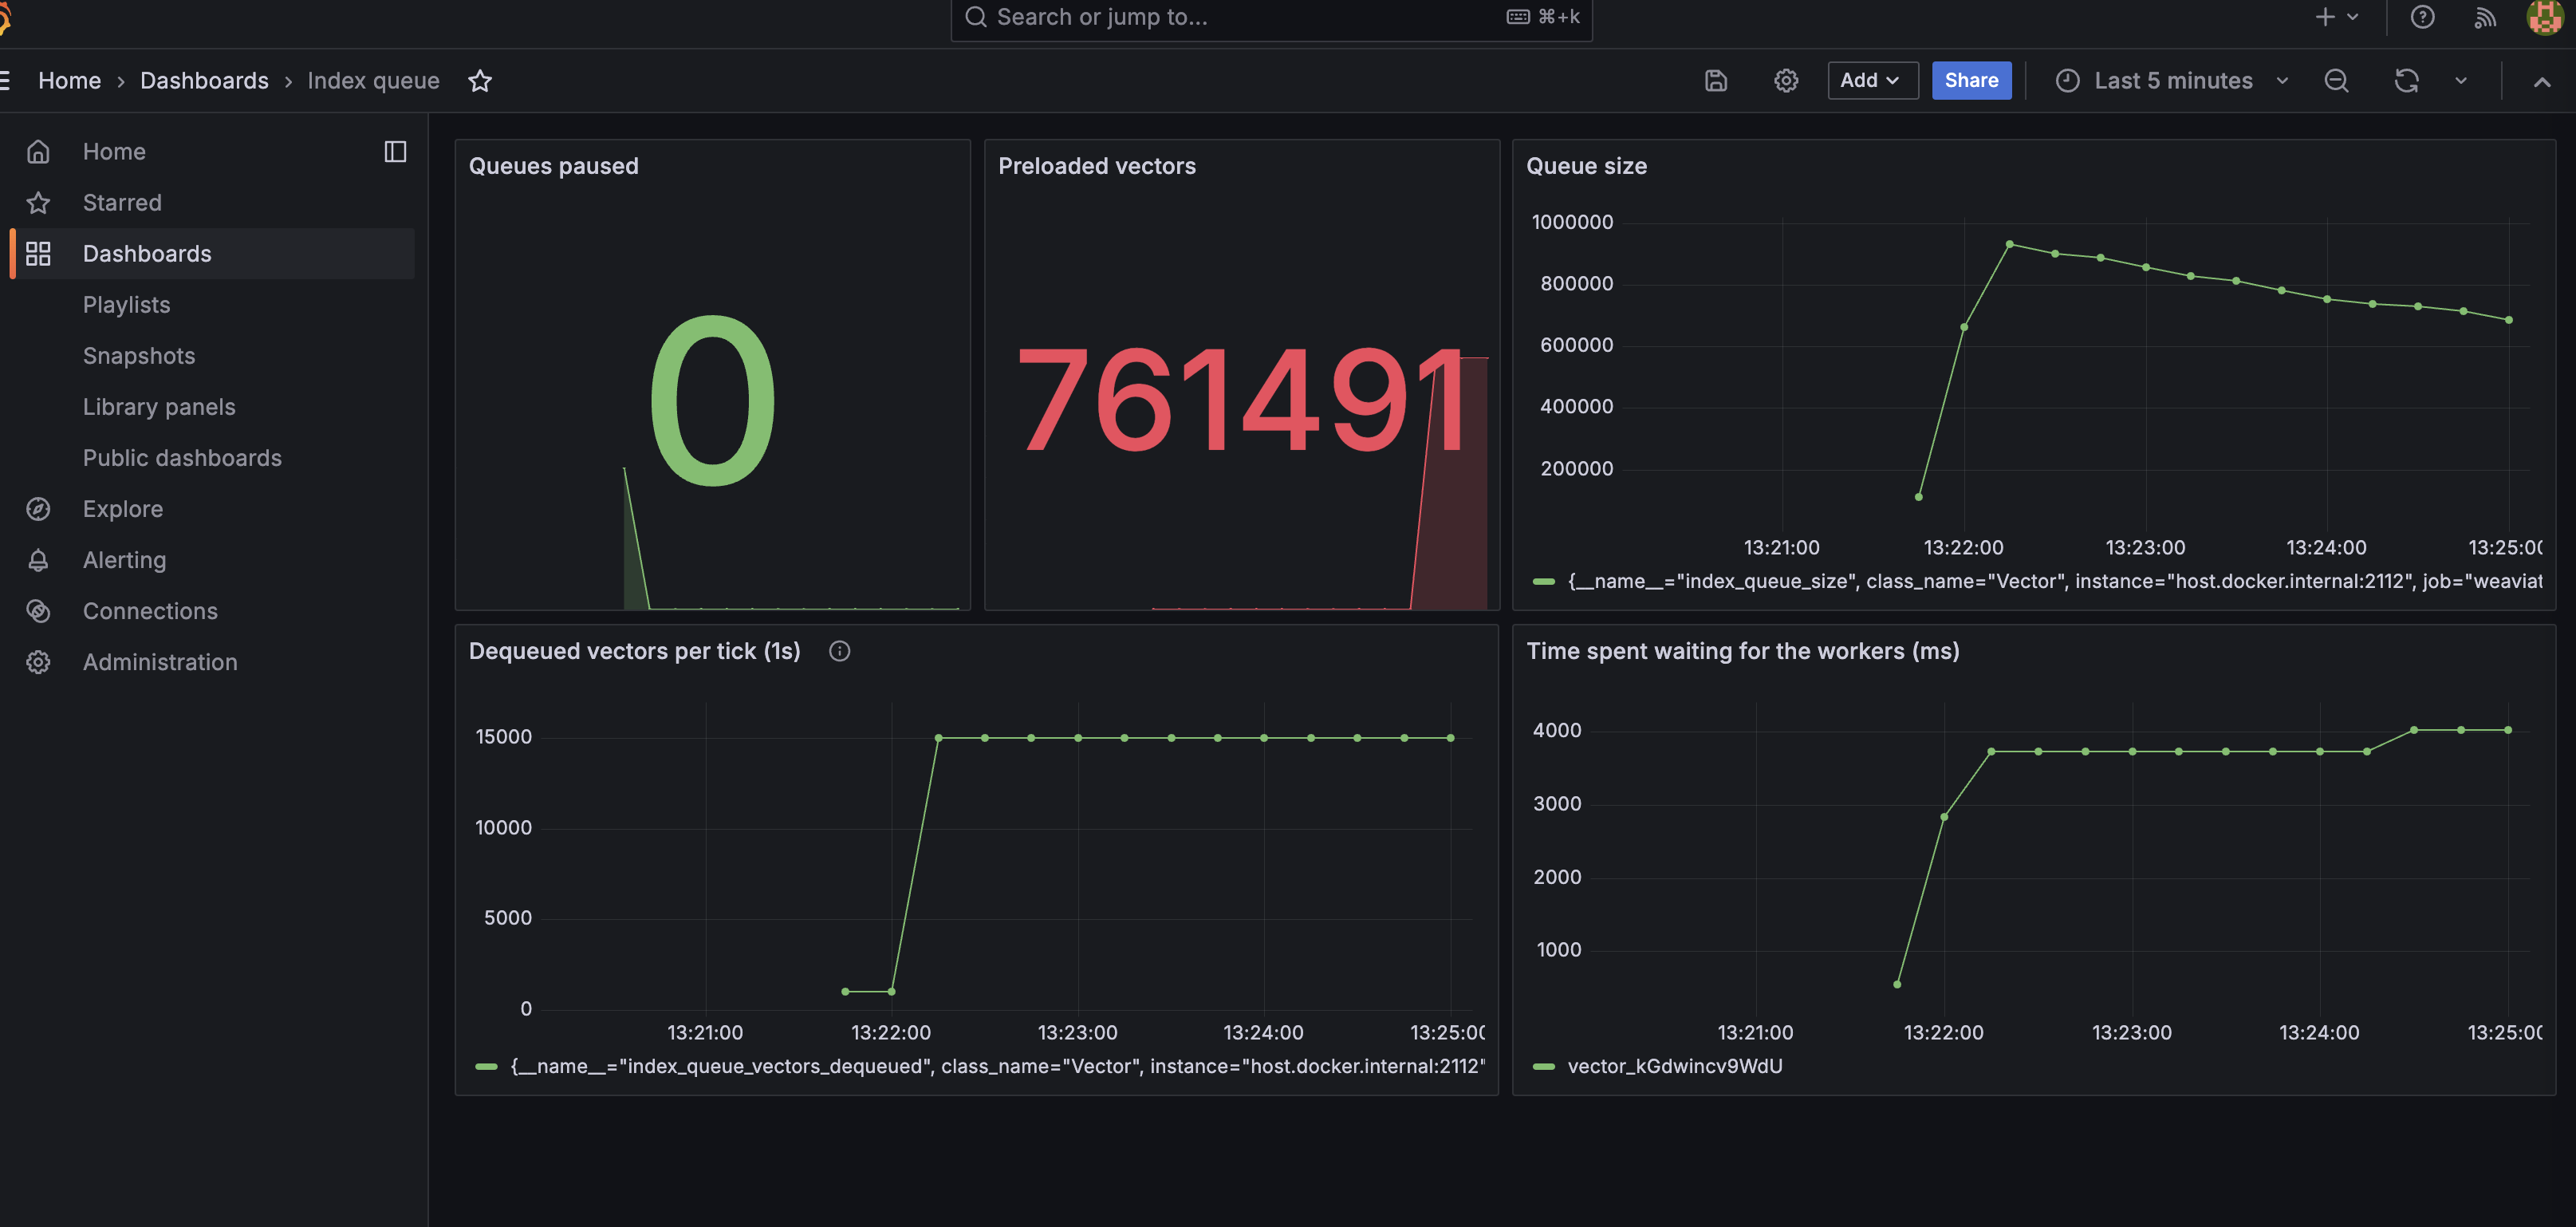
Dashboard Purpose Preview Cluster Workload in Kubernetes Visualize cluster workload, usage and activity in Kubernetes Importing Data Into Weaviate Visualize speed of import operations (including its components, such as object store, inverted index, and vector index) Object Operations Visualize speed of whole object operations, such as GET, PUT, etc. Vector Index Visualize the current state, as well as operations on the HNSW vector index LSM Stores Get insights into the internals (including segments) of the various LSM stores within Weaviate Startup Visualize the startup process, including recovery operations Usage Obtain usage metrics, such as number of objects imported, etc. Aysnc index queue Observe index queue activity
nodes API Endpoint To get collection details programmatically, use the nodes
The nodes endpoint returns an array of nodes. The nodes have the following fields:
name: Name of the node.status: Status of the node (one of: HEALTHY, UNHEALTHY, UNAVAILABLE, INDEXING).version: Version of Weaviate running on the node.gitHash: Short git hash of the latest commit of Weaviate running on the node.stats: Statistics for the node.
shardCount: Total number of shards on the node.objectCount Total number of indexed objects on the node.
shards: Array of shard statistics. To see shards details, set output == verbose.
name: Name of the shard.class: Name of the collection stored on the shard.objectCount: Number of indexed objects on the shard.vectorQueueLength: Number of objects waiting to be indexed on the shard. (Available starting in Weaviate 1.22 when ASYNC_INDEXING is enabled.)
Questions and feedback
If you have any questions or feedback, let us know in the user forum .
